Skip to Content
CFX Coolers
How do I read the graph in the CFX3 app?
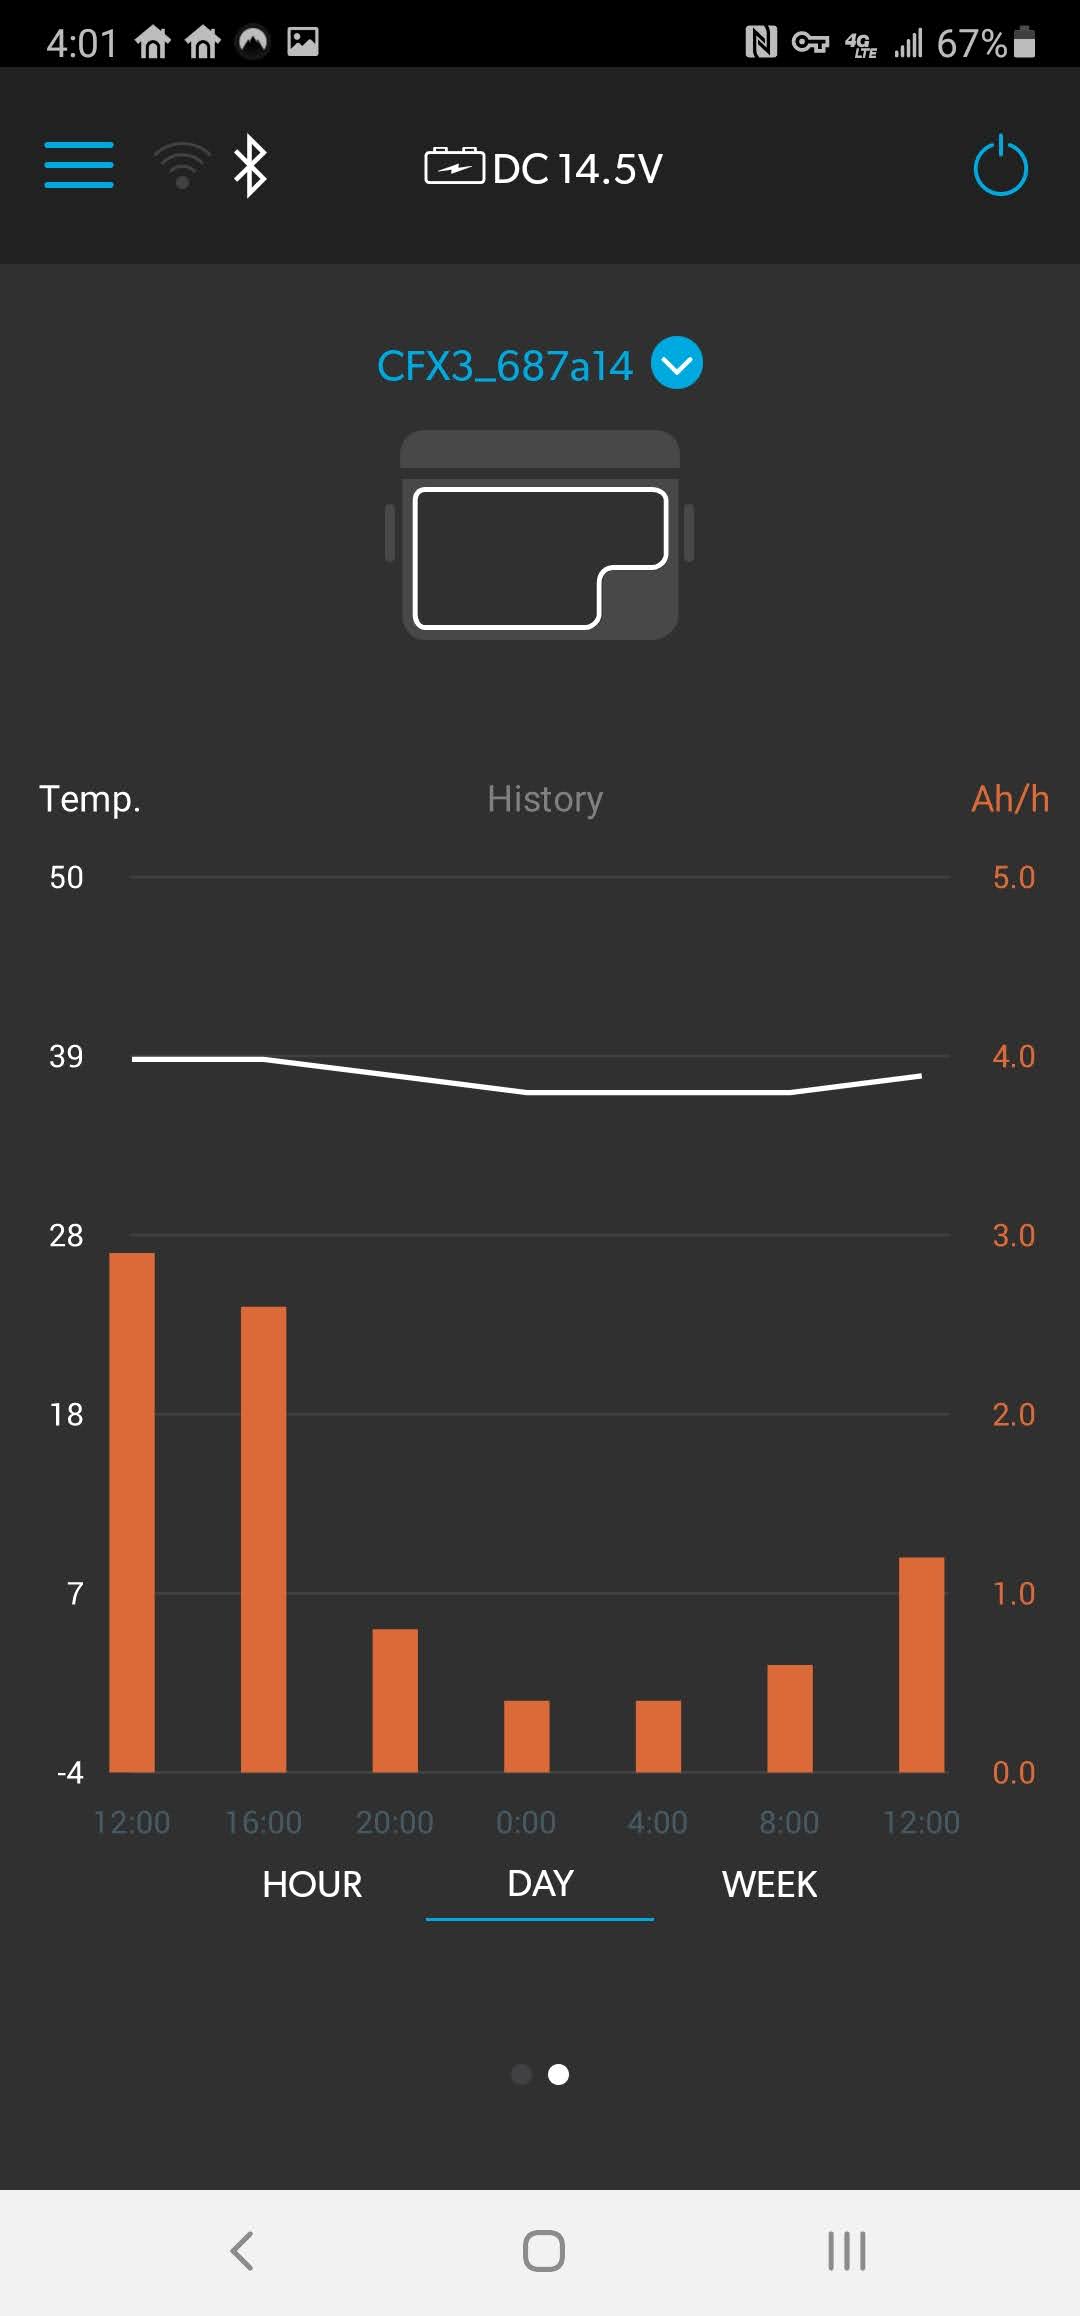
The graph shows two things:
Historical internal temperature (F)
Energy consumption (Ah/h).
Temperature scale is on the left, represented by a white curve. Energy Consumption scale is on the right, represented by orange bars.
Note: the Energy Consumption is only displayed when using DC power.